Data visualization for amusement park operation
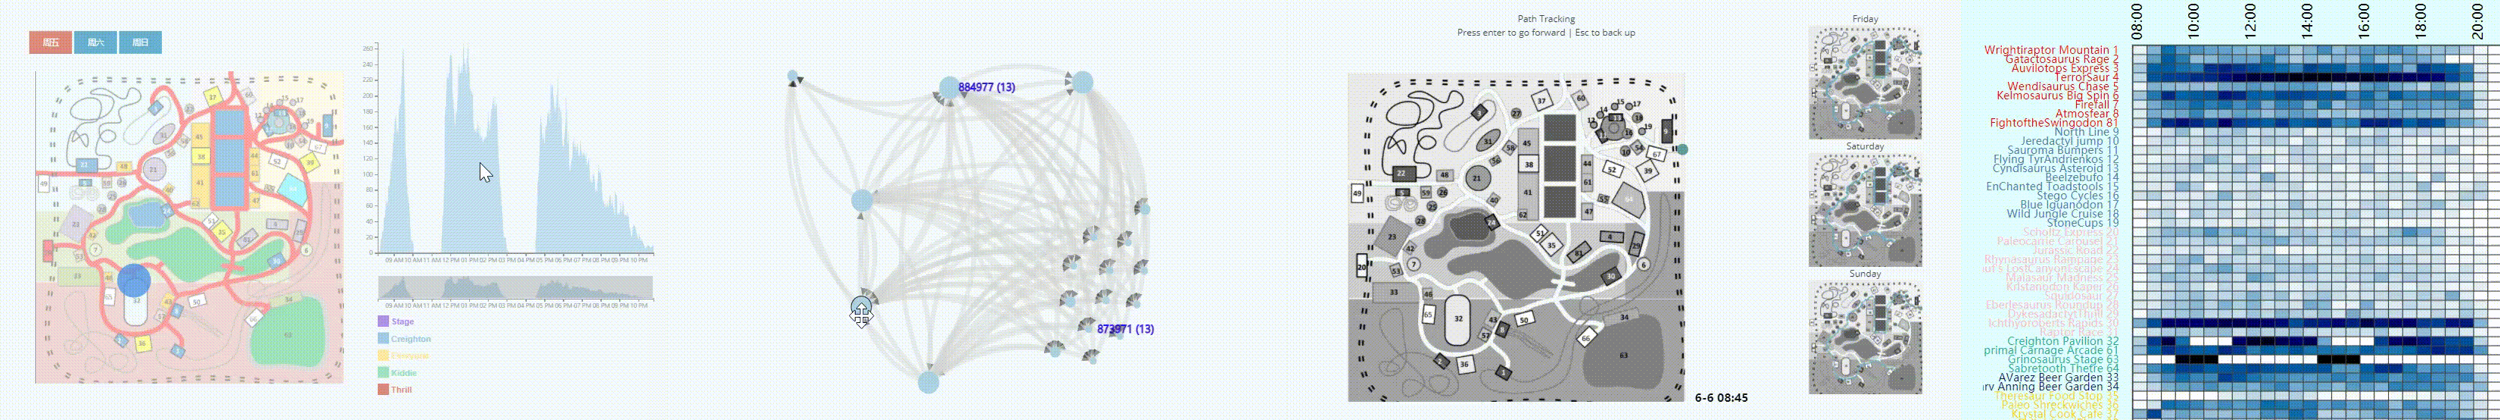
This visualization project mainly proposes relevant suggestions for the current operation of the amusement park through passenger flow time series changes, communication networks among personnel, the popularity of various projects, and trajectory inference of people without ID. This was my end-of-term project for the data visualization course during my undergraduate studies, and I achieved the highest score in the entire department for this course.
Passenger flow time series changes
Thinking process
Engaging in the assessment of park security, I started by contrasting the actual number of attendees against the ideal figure. To further dissect the issue, I gathered data on the park's foot traffic at different timings, visualizing the information in a spatiotemporal map. Upon close examination, I noted an abnormal occurrence - three individuals were found within the park premises even though it was closed on Sundays. This observation led me to conclude that the existing security measures were inadequate. Consequently, I put forth a recommendation to augment the checks during closures, ensuring the park is vacated properly.
Communication networks among personnel
Thinking process
I initiated a communication analysis based on the statistical mapping of point-to-point distributions. The goal was to delineate the communication links between tracked personnel and park-goers. I first constructed a graph, followed by data extraction and model driving. The results were then displayed. By clicking on a node, any related nodes would become highlighted, allowing me to visually inspect the communication lines and thus, understand the communication flow.
Trajectory inference of people without ID
Thinking process
The challenge involves establishing the path of a visitor lacking identification. To solve this, I would reverse engineer the situation by disregarding typical visitor pathways and focusing instead on those of the visitor's eight acquaintances. The first part of the resolution process involves sifting through data using Python to extract relevant information. Subsequently, the filtered data is used to visualize the anonymous visitor's likely route, providing a coherent presentation of the results.
Popularity of various projects
Thinking process
The objective here focuses on enhancing the distribution of venues in the amusement park. This involves examining the volume of attendees across various periods and at different locations, identifying areas of inadequate distribution, and proposing necessary adjustments. This process utilizes a heat map where foot traffic density can be determined based on the color gradients. Upon analysis, I observed that the haunted house has a consistently high demand throughout the day. However, it remains the sole horror-themed attraction in the entire park. Consequently, I propose either the expansion of the current haunted house or the introduction of new horror-themed attractions, provided the cost implications are favorable.